This page may be viewed in:
River cleanup involves scientific studies, design planning, cleanup construction, and pollution source control. EPA’s cleanup plan identifies cleanup technologies. Some are “active” technologies that rely mostly on removal (dredging) and containment (capping). Other methods, like natural recovery, are “passive” and rely on the natural flow and deposition of cleaner sediments from upriver to cover the contaminated sediments.
About the Cleanup
The cleanup has several parts:
- Determine the extent of contamination and risks for people and wildlife
- Design the cleanup
- Control sources of contamination
- Clean up contaminated sediments
- Monitor to ensure the cleanup remains effective and meets its goals
Method of Cleanup
A few cleanup methods will be used to clean up LDW sediment (the bottom of the river). Learn about them here:

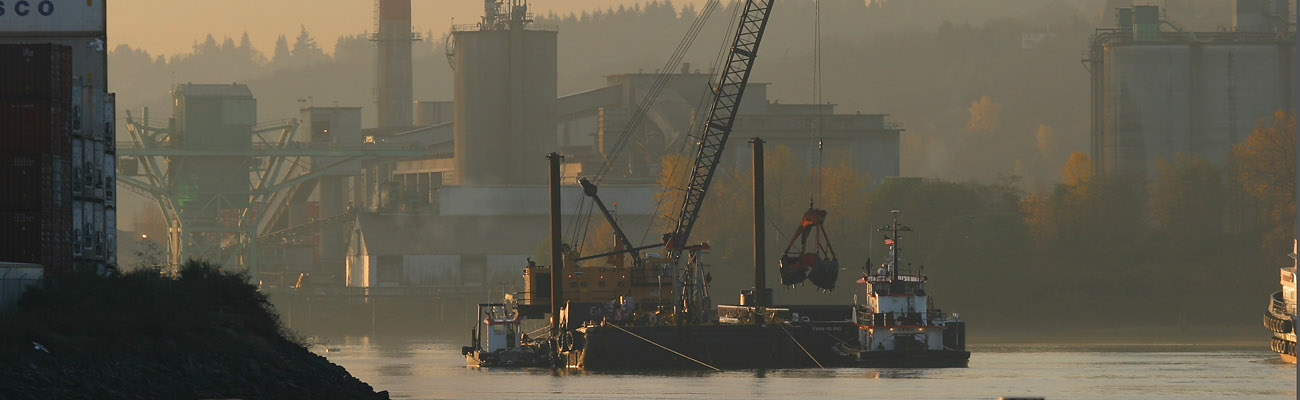
Dredging removes contaminated sediments from the waterway. After removal, dredged material will be disposed of in a permitted landfill.

Capping covers the contaminated sediments with engineered layers of sand, silt, gravel and rock to contain and isolate the contamination.

Monitored Natural Recovery (MNR) relies on the movement of cleaner sediments from upriver to cover contaminated sediments in the waterway. The sediments are monitored to measure the reduction in contamination over time.

Enhanced Natural Recovery (ENR) uses a thin layer of sand to speed up the natural recovery process.